❄️ Welcome, friends of polar microbes! ❄️
polarDNAexplorer visualizes the dynamics and drivers of microbial communities in polar oceans. Users can explore microbial abundances, derived from metabarcoding of ribosomal amplicons, in context of environmental parameters.
Microbial patterns can be explored via interactive plots:
polarDNAexplorer includes two datasets from the FRAM / HAUSGARTEN long-term observatory in Fram Strait (Arctic Ocean). Via the left dropdown menu, please select study and organisms of interest. Then select the type of analysis, and optionally filter by taxonomy or any metadata variable. Datapoints can be colored by categorical (e.g. month) or continous variables (e.g. depth).
For more information, please see the Documentation.
Datasets
Year-round, autonomous sampling in Fram Strait (FRAM_MOORINGS)
Continuous samplings using automated devices (2016-2020) on seafloor moorings:

Available numerical variables: water temperature, salinity, oxygen concentration and saturation, chlorophyll-a, fraction of Atlantic and Polar Water, mixed layer depth, sea-ice cover, distance to sea-ice edge, daylight hours. Categorical variables: mooring, date, year, month (all-year average), month-year (per-year average).
Accompanying papers: Wietz et al. 2021 , Priest et al. 2023
Annual summertime sampling across Fram Strait (FRAM_TRANSECT)
Microbes, biogeochemistry and oceanography, sampled every summer (2015-2019) along the euphotic zone. Western and Eastern Fram Strait represent Arctic- and Atlantic-influenced ecosystems, respectively.
Available numerical variables: water temperature, salinity, oxygen concentration and saturation, chlorophyll-a, concentrations of amino acids / carbohydrates / sugar acids / amines, sea-ice cover, distance to sea-ice edge. Categorical variables: region, station, date, year.
Accompanying paper: Wietz et al. 2024
The Team

❄️ Documentation and background ❄️
The Alfred Wegener Institute Helmholtz Centre for Polar and Marine Research does interdisciplinary science in the polar regions. The taxonomic and functional diversity of microbial communities is studied via sequencing of environmental DNA (eDNA) from bacteria, archaea, phytoplankton, and zooplankton.
polarDNAexplorer visualizes eDNA studies of microbial communities in the Arctic Fram Strait. Detailed information about the app functions and scientific background can be found below.
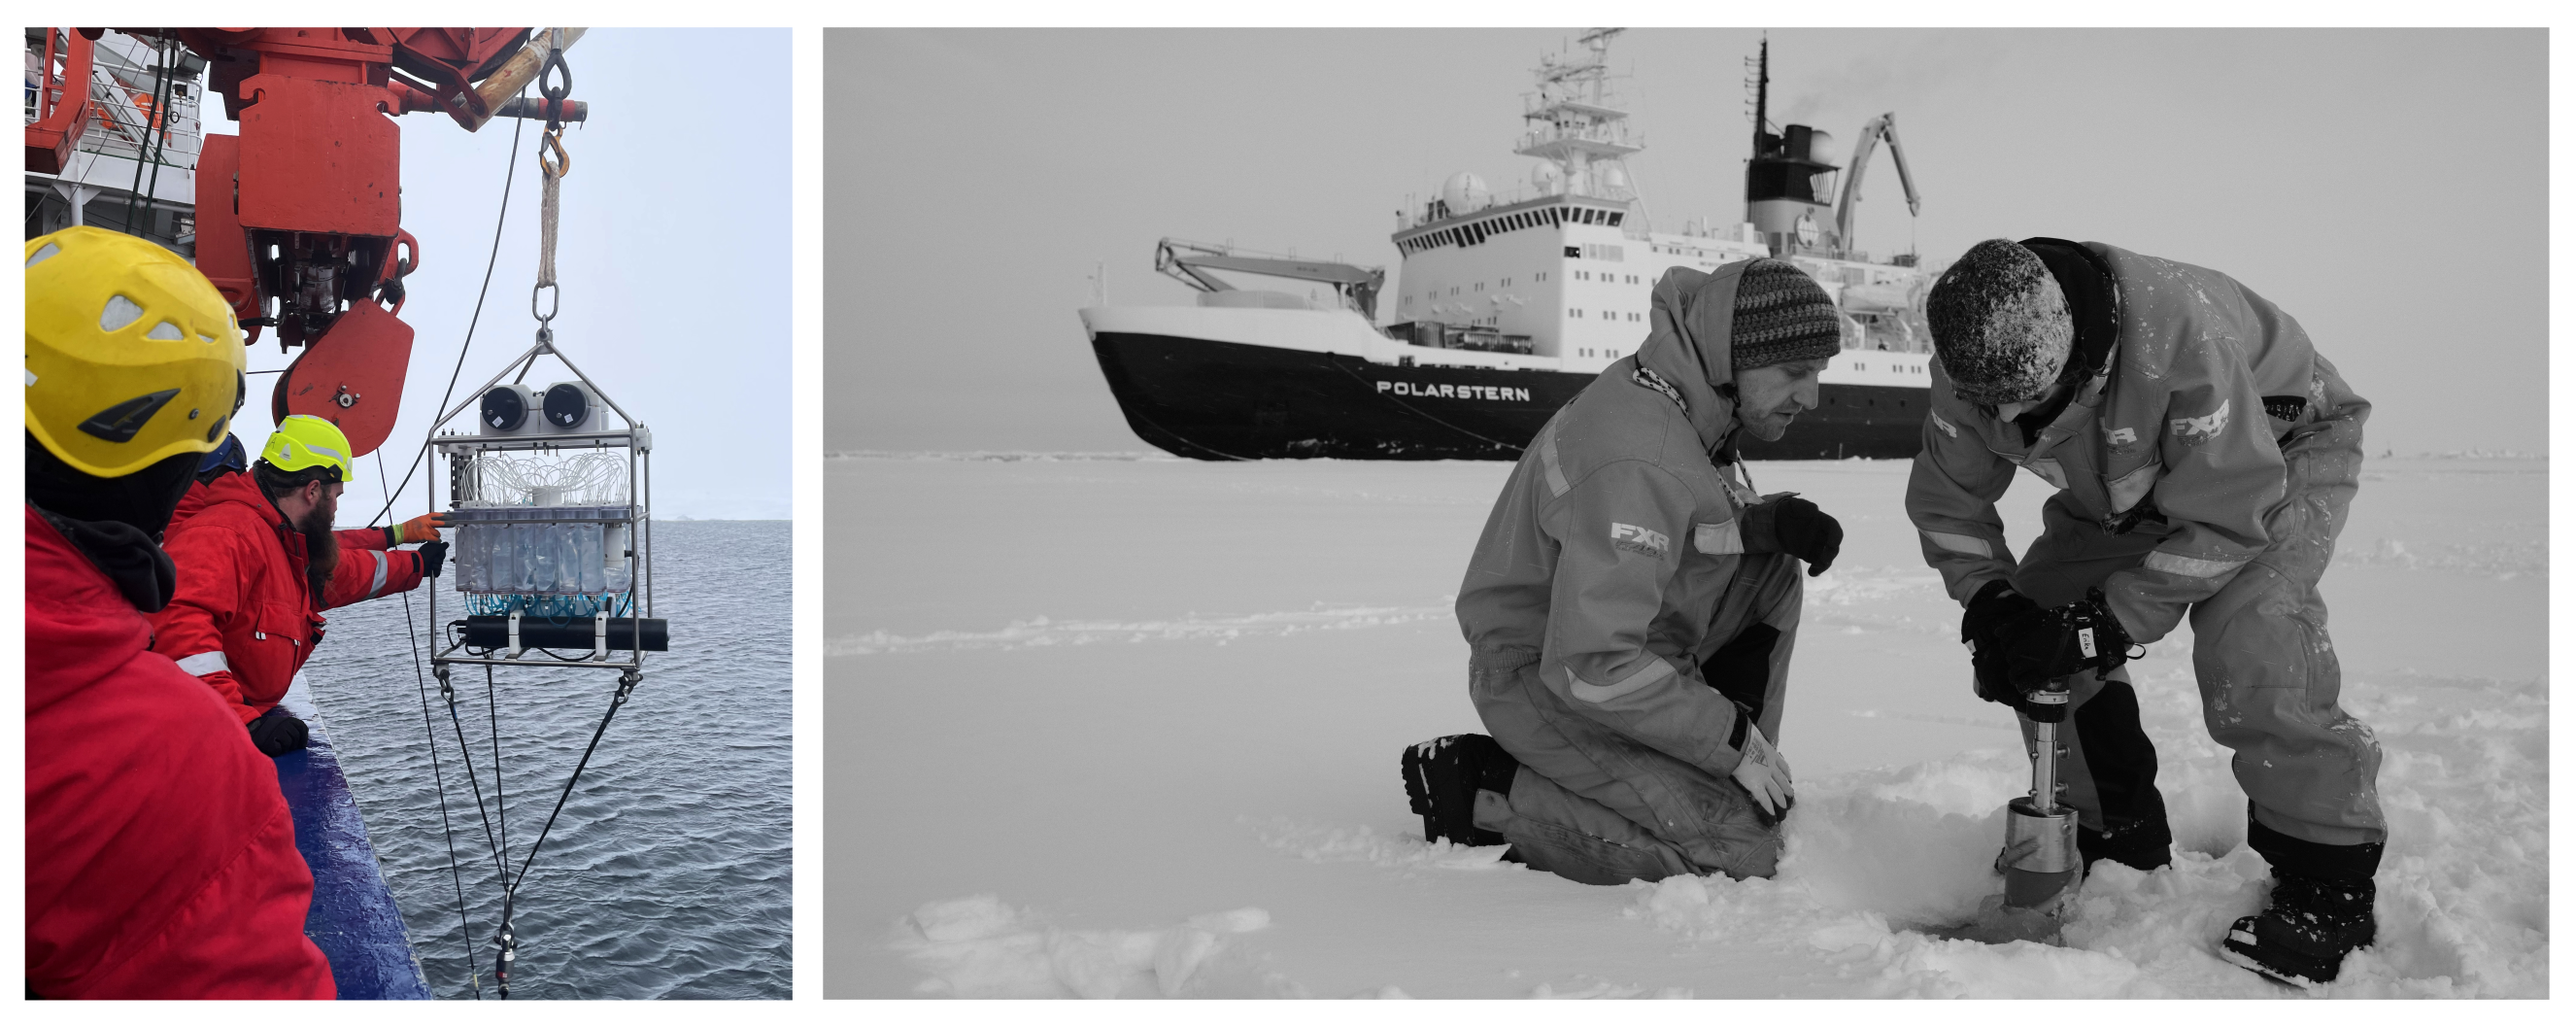
Sampling in polar environments: moored autonomous instruments (left) and sea-ice coring (right).
Pictures: Matthias Wietz, Mario Hoppmann.
App functionality
polarDNAexplorer bases on the R package ampvis2. Please check the
package documentation
to read about the underlying principles.
First, use the Select dataset dropdown menu on the left sidebar to select the dataset of interest.
Below the dropdown, select the desired type of analysis. The submenu allows further filtering
by metadata variable or specific taxa.
Clicking Plot opens the right sidebar, showing visualization options such as grouping samples by a metadata variable.
By default, amplicons with <0.1% abundance across samples are removed. Plots base on
ggplot2, and can be exported as PDF or PNG.
Details about each analysis type, and the underlying ampvis2 function, are described in the following.
• Alpha-Diversity (function amp_alphadiv ;
click for details) shows species diversity via a range of indices (e.g. Simpson, Shannon, Chao1, Pielou). To account for different sequencing depth,
samples can be rarefied to even depth.
• Ordination (function amp_ordinate ;
click for details) supports 7 methods: unconstrained (PCA, CA, DCA), constrained (RDA, CCA), and distance-based (PCoA, NMDS).
Data can be normalized using Hellinger, square-root and other transformations.
Interactive plots are generated via Plotly,
showing metadata when hovering the cursor over datapoints.
• Heatmap (function amp_heatmap ;
click for details) generates a heatmap by aggregating samples and taxonomy. Plots can be customized by facetting, selecting specific
taxonomic levels, defining the number of taxa shown, and whether abundances are shown. By default, taxa are ordered by mean read abundance
across all samples, visualized via a log10-transformed color gradient.
• Boxplot (function amp_boxplot ;
click for details) also displays relative read abundances, but showing the variability and
possible outliers. Plots can be customized like heatmaps.
• Time-series (function amp_timeseries ;
click for details) displays relative read abundances over time. In case of strongly different abundances,
set free y-axes.
Screenshot showing the dataset selection, with subsetting options (metadata and taxonomy) per visualization type. In this example, function Alpha-Diversity is applied to dataset MOORING, plotting the inverse Simpson index by season:

Datasets and examples
polarDNAexplorer includes the following datasets:
FRAM_MOORINGS contains 16S rRNA amplicons derived from autonomous sampling in Fram Strait. Since 2016, moored Remote Access Samplers collect seawater in weekly to monthly intervals – establishing a high-resolution portrait of marine microbial ecology over polar day and night. This approach revealed microbial dynamics across seasonal gradients and sea-ice regimes. Ongoing studies provide a mathematical perspective on community assembly on taxonomic and functional levels.
FRAM_TRANSECT contains 16S rRNA amplicons from surface, chlorophyll-max and lower-euphotic waters across Fram Strait (6°E to 12°W). Samples were collected in the summers of 2015-2019 using Niskin bottles on the CTD rosette. The corresponding paper plus other studies that link microbial and chemical patterns establish a detailed microbial-biogeochemical inventory – an ecosystem benchmark helping to predict the future, warming Arctic Ocean.
The following examples base on the datasets included. The left ordination, subsetted to mooring
WSC via Filter metadata and selecting month as grouping variable, shows month-specific communities in year-round
samplings (FRAM_MOORINGS). The right heatmap shows the ten most abundant genera of family Flavobacteriaceae
(subsetted via Filter taxonomy) in four water layers across Fram Strait (FRAM_TRANSECT).

Additional information
eDNA helps characterizing polar microbial diversity in context of natural gradients and antropogenic stressors. At Alfred Wegener Institute, related initiatives include the Molecular Observatory within the LTER FRAM / HAUSGARTEN in Fram Strait, as well as autonomous eDNA analyses of Southern Ocean microbiomes. Here, we perform year-round samplings of water and sinking particles via autonomous devices, plus summertime expeditions to sample sea-ice, seawater and sediment. This complementary evidence illuminates spatial and temporal patterns of biodiversity, their environmental drivers, and biogeochemical implications. Our research contributes to a mechanistic understanding of ecosystem functionality in polar oceans, for instance showing how contrasting sea-ice regimes influence phytoplankton blooms, the biological carbon pump, and benthopelagic coupling.
We emphasize interdisciplinary cooperation within AWI and beyond, including MPI for Marine Microbiology, GEOMAR, HIFMB, and Düsseldorf University. FAIR science is a key concept, for instance through harmonizing metadata with global standards and repositories such as PANGAEA – promoting the interoperability of biomolecular data.
Imprint
Copyright and Rights of Use: The content of this website is protected by copyright. Private use of images (e.g. copying plots to your private computer, use in academic presentations) is allowed. Editorial journalistic publications are possible under the condition that the AWI and polarDNAexplorer are mentioned. Please check this website for detailed information.
Editorial Responsibility: Matthias Wietz (section Deep-Sea Ecology and Technology)
Liability and Privacy Notice: The provider of this website is the Alfred Wegener Institute, Helmholtz Centre for Polar and Marine Research ( Am Handelshafen, 27570 Bremerhaven; http://www.awi.de. The AWI is legally represented by Prof. Dr. Antje Boetius (Director) and Dr. Karsten Wurr (Administrative Director). The complete privacy policy can be accessed here.
Filter metadata
Filter taxonomy
Alpha-diversity
Options
Filter metadata
Filter taxonomy
Heatmap
Settings
Filter metadata
Filter taxonomy
Boxplot
Settings
Filter metadata
Filter taxonomy
Time series
Settings
Loading...
Filter metadata
Filter taxonomy
Ordination
Settings
Loading...